Your first dashboard
This walks you from an empty directory to a dashboard with a clock down one side and live weather
readouts down the other. All you need is Grydgets installed so that the grydgets
command works.
Make a directory to work in and run everything from inside it. Grydgets looks for its configuration in the current directory.
1. A simple clock
Grydgets needs two files to start. The first one, conf.yaml, describes how it runs on this
particular machine:
graphics:
  fps-limit: 10
  resolution: [800, 480]

logging:
  level: info

outputs:
  - type: window
fps-limit: the most times per second the dashboard gets redrawn. Clocks update once a minute, so 10 is plenty. Keep this low on slow devices like a Raspberry Pi: I use 1 fps on mine.resolution: the size of the dashboard, in pixels.logging.level:debug,info, orwarning.debugis very verbose, but it's helpful to see how Grydgets lays everything out when you're first starting out.outputs: where the finished picture goes. Awindowis the easy one to start with, but this is also where you'd configure Grydgets to save to a file on disk or send to another machine entirely.
The second file, widgets.yaml, is the dashboard itself. For the moment let's add exactly one
widget:
Every widget has a widget: key naming its type. Run it:
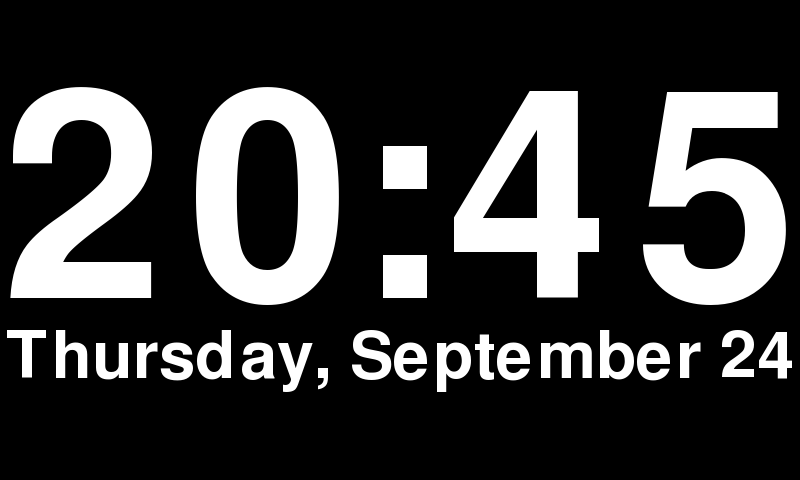
There! The clock gets the entire window, since there's nothing else to share it with. We didn't specify a text_size, so the clock grew to fit whatever space it was handed, which is why the numbers are
so enormous.
On startup, Grydgets prints a "Hello from the pygame community" line. That comes from PyGame, the library Grydgets draws with, and you can ignore it. The rest of the log is Grydgets telling you what it loaded, and if something goes wrong later, this is where the error will show up.
On a Raspberry Pi without a desktop
Set fullscreen: true on the window output and start Grydgets as usual. When there's no
desktop to open a window in, the window takes over the whole screen directly instead. See
Running without a desktop for the details.
To quit, close the window, or click anywhere inside it.
Keep Grydgets running for the rest of the tutorial. You can tell it to reload the widget file without restarting, by running this in another terminal each time you save a change:
This is called a hot reload. If you'd rather not bother, quitting and running
grydgets again works just as well.
2. Two widgets side by side
To get multiple widgets on the screen, you have to tell Grydgets how to
divide up the space. That's the job of a container widget: one whose children are other widgets. The
container you'll use most is grid, which takes a number of rows and columns and draws its
children into the cells.
Grids fill a column at a time
The first child goes top left, and the next one goes underneath it rather than beside it. With a single row, like the one below, there's no difference. As soon as you add a second row it matters a lot.
Replace widgets.yaml with this:
widgets:
  - widget: grid
    rows: 1
    columns: 2
    children:
      - widget: dateclock
      - widget: text
        text: 'Hello'
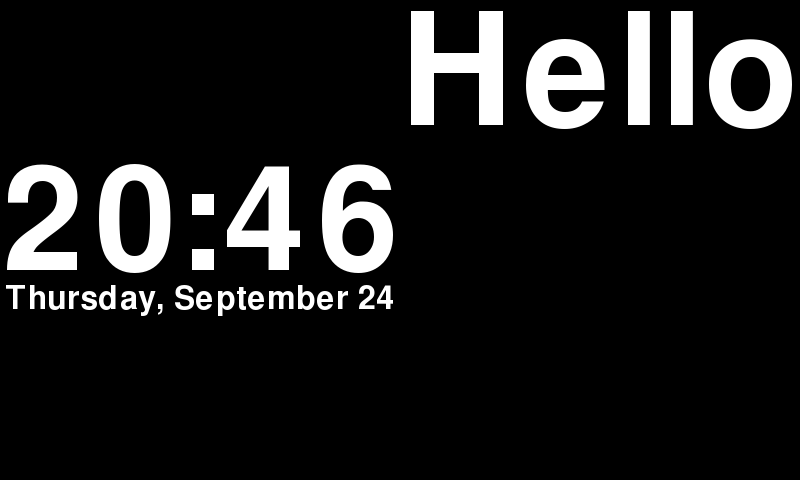
The clock has moved into the left half and there is a big Hello in the right one, though you'd be forgiven for not seeing a grid there: the grid doesn't draw anything to show where one cell stops and the next one starts. Step 3 will make things nicer.
The widget in each cell is automatically sized to fit its own contents. Since "Hello" is a much shorter string than the date, it gets blown up to a much bigger size to fill its half.
You've probably also noticed that Hello is stuck at the top of its cell, while the clock
is nicely centered. That's just the defaults: a text widget starts at the top left, and dateclock
centers itself. You can change that with align (left, center or right) and vertical_align
(top, center or bottom):
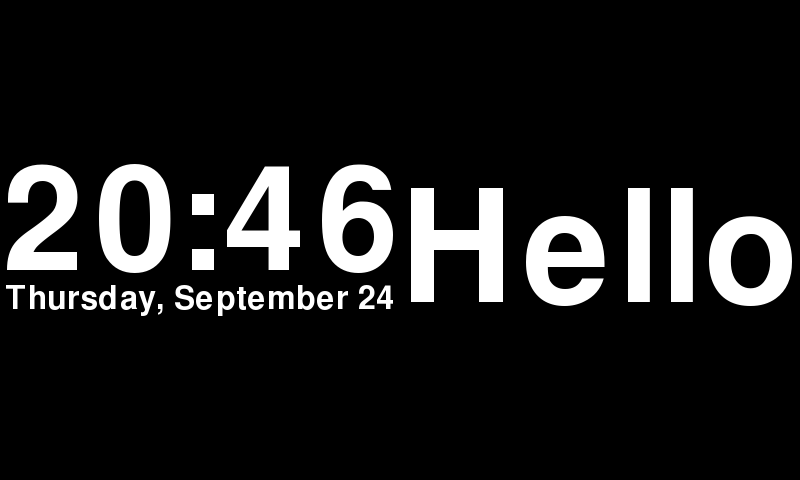
Cells are all the same size by default. You can use row_ratios and column_ratios to change that, so
column_ratios: [2, 3] would give the right column 1.5 times the width of the left one. Grids can be nested without a problem: a cell can hold another grid, and most real dashboards are built out of a bunch of grids inside each other.
Hyphens and underscores
conf.yaml uses hyphens in its keys (fps-limit), while widgets use underscores
(vertical_align, column_ratios). If you have a wrong key in conf.yaml Grydgets won't start, but
misspelled widget parameters are ignored without a warning, so if a setting doesn't seem to do
anything, check its spelling first. If your editor supports it, schema.json
will catch these as you type.
3. Make it look nicer
So far it's white text on black. Kinda boring. Thankfully, grids can apply colors to their cells:
background_color: '#2e3440'
widgets:
- widget: grid
rows: 1
columns: 2
padding: 8
widget_background_color: '#3b4252'
widget_corner_radius: 12
children:
- widget: dateclock
      - widget: text
        text: 'Hello'
        align: center
        vertical_align: center
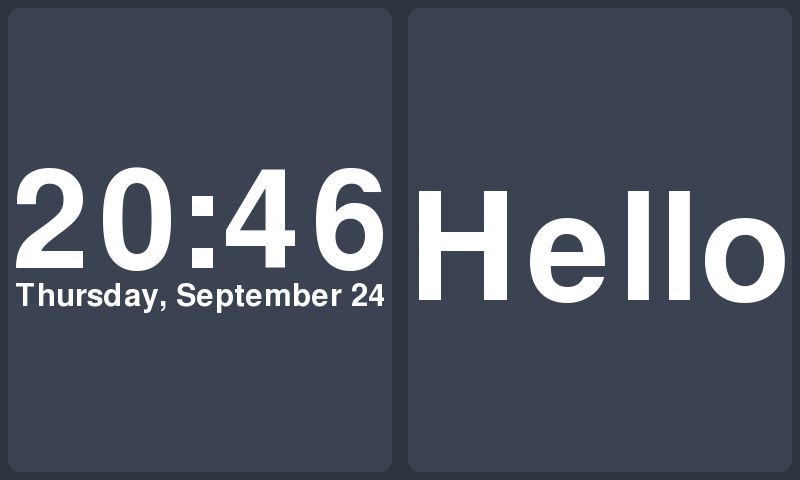
padding is the gap left around each cell. widget_background_color and widget_corner_radius are
applied to every cell separately, so each half of the screen gets its own rounded panel, and you can
finally see where the grid cells actually are.
Quote your hex colors
An unquoted # starts a comment in YAML, so background_color: #2e3440 would parse as an empty
value and Grydgets would stop at startup with background_color: None is not a color.
Tip
Every color parameter also accepts [r, g, b] lists with each component from 0 to 255, if you like that better. See
Colors.
4. Show live data
So far, every widget has drawn something that was written in the file. The rest widget goes out
and gets its own data instead: it makes an HTTP request on a timer, digs a value out of the JSON that
comes back, and draws that.
To see how it all works, we can use the always excellent wttr.in, which hands you a weather report for any city in the world without asking for an API key.
While we're here, label is another container. It takes a single child and puts a caption above or
below it:
background_color: '#2e3440'

widgets:
  - widget: grid
    rows: 1
    columns: 2
    padding: 8
    widget_background_color: '#3b4252'
    widget_corner_radius: 12
    children:
      - widget: dateclock
      - widget: label
        text: 'Outside'
        position: below
        text_size: 30
        color: '#a3afc2'
        children:
          - widget: rest
            url: 'https://wttr.in/Toronto?format=j1'
            json_path: 'current_condition[0].temp_C'
            format_string: '{}°C'
            text_size: 150
            update_frequency: 900
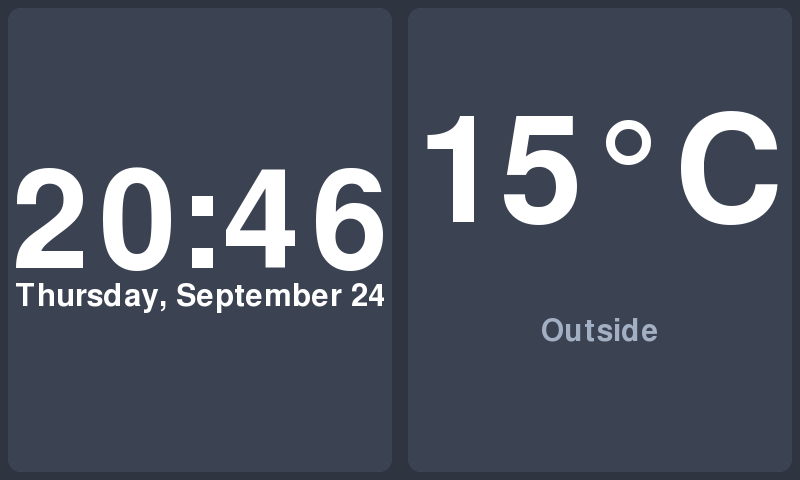
The rest widget takes these parameters:
url: what to request. In this case, the weather in Toronto.json_path: where to find the value in the JSON response.current_condition[0].temp_Ctakes the first entry of thecurrent_conditionlist and then itstemp_Cfield. For anything more involved than a path there'sjq_expression, see Data extraction.format_string: a Python format string to apply to the result.text_size: a cap, in pixels, on how big the text is allowed to get. If the text is too big to fit inside the cell, it will shrink belowtext_sizeuntil it fits.update_frequency: how often to request new data, in seconds. It defaults to 30, but that's a lot to ask of a free service for a number that changes every few hours, so in our example we increased it to 900.
text_size is the fix for the problem you saw back in step 2, where Hello came out enormous. The rest widget centers its text by default, so you don't need align here.
The rest widget is the child of a label, which takes position: below to put the caption under its child instead of
above it. color is set to gray rather than white like the temperature, so the two lines
don't compete visually. The caption always gets a third of the cell's height, which is why there's a bit of a
gap between the two in a cell this tall. We'll fix this in the next step, where the cells get
shorter.
5. Room for more than one number
Half a screen for a single temperature is a bit of a waste. As mentioned in step 2, a grid cell can hold another grid, so the right-hand half can be split into three readouts of its own.
There's one snag. A grid paints widget_background_color behind every one of its cells, so leaving
it on the outer grid would put a panel behind the inner grid, and then the inner grid would paint
three more panels on top of it. To avoid that, we'll change the outer grid so it doesn't paint anything, let the inner one
paint its three cells, and give the clock its own background: dateclock takes a background_color
and a corner_radius directly, so you don't have to wrap it in a grid to give it a panel.
background_color: '#2e3440'

widgets:
  - widget: grid
    rows: 1
    columns: 2
    padding: 8
    column_ratios: [3, 2]
    children:
      - widget: dateclock
        background_color: '#3b4252'
        corner_radius: 12
        date_color: '#a3afc2'

      - widget: grid
        rows: 3
        columns: 1
        padding: 8
        widget_background_color: '#3b4252'
        widget_corner_radius: 12
        children:
          - widget: label
            text: 'Outside'
            position: below
            text_size: 22
            color: '#a3afc2'
            children:
              - widget: rest
                url: 'https://wttr.in/Toronto?format=j1'
                json_path: 'current_condition[0].temp_C'
                format_string: '{}°C'
                text_size: 60
                update_frequency: 900

          - widget: label
            text: 'Humidity'
            position: below
            text_size: 22
            color: '#a3afc2'
            children:
              - widget: rest
                url: 'https://wttr.in/Toronto?format=j1'
                json_path: 'current_condition[0].humidity'
                format_string: '{}%'
                text_size: 60
                update_frequency: 900

          - widget: label
            text: 'Wind'
            position: below
            text_size: 22
            color: '#a3afc2'
            children:
              - widget: rest
                url: 'https://wttr.in/Toronto?format=j1'
                json_path: 'current_condition[0].windspeedKmph'
                format_string: '{} km/h'
                text_size: 60
                update_frequency: 900
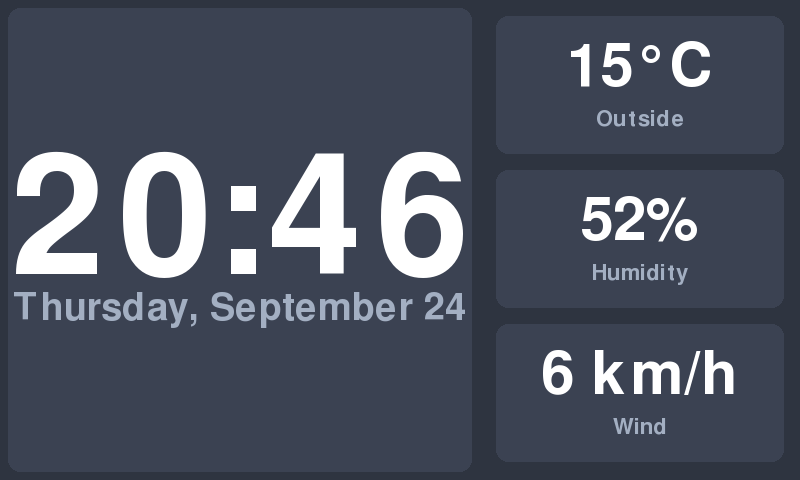
column_ratios: [3, 2] splits the two columns three parts to two, so the clock gets the bigger
share. The three readouts are capped at 60 instead of 150 because they're in much shorter cells now,
and by using the same cap the two-digit humidity and the six-character wind speed don't
render at different sizes.
6. A nicer font
Everything so far has been drawn with PyGame's built-in font, FreeSans Bold. It does the job, but
it's a bit plain, and some characters look slightly off: note the gaps around the ° in the
temperature.
Any .ttf file will do. PT Sans is a good one to start
with: it's free to use under the Open Font License, and it looks a little more interesting. Download the regular and bold versions into a fonts directory:
mkdir fonts
curl -L -o fonts/PTSans-Regular.ttf https://github.com/google/fonts/raw/main/ofl/ptsans/PT_Sans-Web-Regular.ttf
curl -L -o fonts/PTSans-Bold.ttf https://github.com/google/fonts/raw/main/ofl/ptsans/PT_Sans-Web-Bold.ttf
All widgets that draw text take a font parameter: font_path on rest and label, and
time_font_path and date_font_path on dateclock. You could add those to all seven widgets, but
there's a shorter way. Add a theme block at the top of widgets.yaml, next to background_color,
and leave the widgets: part exactly as it was:
theme:
  defaults:
    dateclock:
      time_font_path: fonts/PTSans-Bold.ttf
      date_font_path: fonts/PTSans-Regular.ttf
    rest:
      font_path: fonts/PTSans-Bold.ttf
    label:
      font_path: fonts/PTSans-Regular.ttf

background_color: '#2e3440'

widgets:
  # ... the same as in step 5
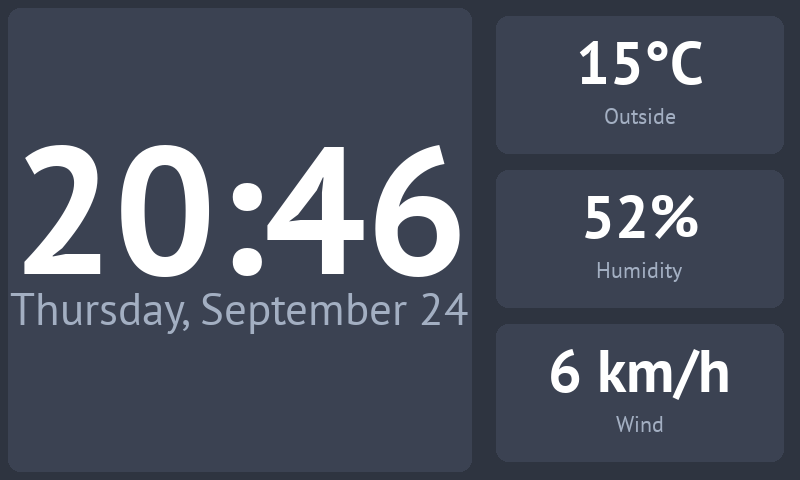
theme.defaults sets parameters for every widget of a given type (but you can still override them on individual widgets). Paths are relative to the directory you're running Grydgets from, like every other path in
the configuration.
What to read next
That's it for the basics. Every dashboard is a tree of widgets, where some of them arrange the others and some of them go off and fetch data. Most of what's left to learn is the individual widgets and their parameters.
The dashboard you just built still has a couple of things to improve on. Reading the rest of the documentation shows you how to deal with them. The first is that '#3b4252', text_size: 22 and color: '#a3afc2' are written
out three and four times each, so if you want to change the look of the dashboard you have to change
every copy. Theming lets you give those values names and set more defaults, the same
way you just did for fonts. The second is that three widgets are asking wttr.in for the same JSON
document. A shared provider can make that request once and hand the response to all three widgets,
see providers.yaml.
- A more advanced dashboard carries on from here: it moves the weather into a provider, adds icons, and uses flips to change what's on screen based on the time and the forecast.
- How the config files fit together covers the two files you just wrote and the two you didn't, and when you'd want them.
- Widgets lists all 17 of them, with every parameter.
- Theming gives colors, fonts and sizes names, and sets defaults per widget type so that most widgets don't have to mention them at all.
- Remote displays, for when the screen on which you want to display the dashboard isn't the machine you want to render it on.